TL;DR
A new report by Intouch Insight examines the state of mobile ordering in the quick-service restaurant (QSR) industry, evaluating the mobile order ahead experience for pickup in the drive-thru and in-store across nine major brands. The report found that efficient ordering flows, speed of service, and friendliness of staff are key factors in determining pickup satisfaction.
Last year’s Emerging Experiences Report—the third iteration in partnership with Intouch Insight—took us across the QSR landscape to visit next-generation designs. Were these elevated, tech-enabled builds satisfying their premise? Had AI infiltrated the guest experience? The answers were a bit mixed, as you’d imagine. What it revealed, among other things, though, was the layered reality of “innovation.”
You can’t talk about asset growth without touching on topics from kiosks to drive-thru to back-of-the-house kitchen upgrades. So, this time, in Year 4, we narrowed the spotlight to one particular avenue of disruption: mobile ordering.
Giving customers what’s essentially a menu board in their pocket changed every corner of restaurant operations. Brands needed to satisfy fulfillment on the go and embrace digital storefronts to mirror dine-in experience. And while adoption has become all but ubiquitous at this point, there are nuanced KPIs spread throughout execution.
Mobile ordering experience
In this report, Intouch Insight evaluated the mobile order ahead experience for pickup in the drive-thru and in-store across nine major quick-service and fast-casual brands.
At the drive-thru, Chick-fil-A and Dunkin’ were tested. Burger King, Chipotle, KFC, McDonald’s, Moe’s Southwest Grill, Whataburger, and Wingstop slotted into the pickup in-person bucket.
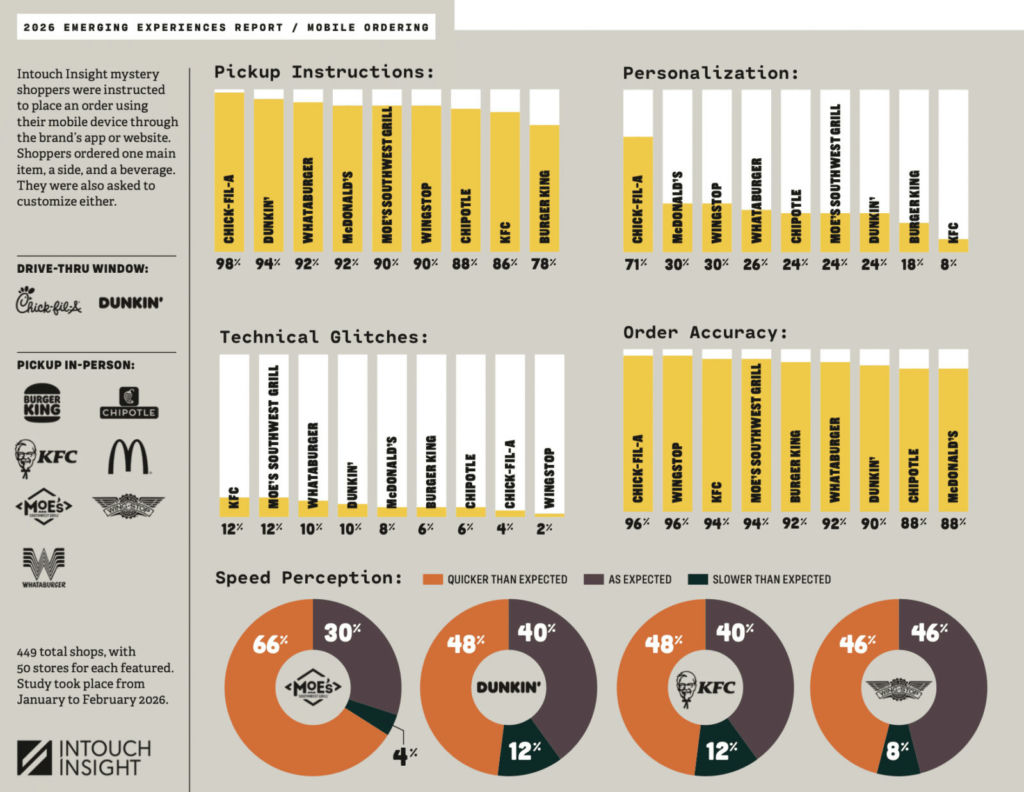
Mystery shoppers were instructed to place an order using their mobile device through the brand’s app or website (this is not a third-party delivery study). We visited 449 total shops, with 50 stores for each featured. Other than Dunkin’, which was shopped in the morning window (5 to 10:30 a.m.), every chain had half its stores piloted for lunch and half for dinner. Shoppers ordered one main item, a side, and a beverage. They were also asked to customize either. This took place from January to February.
Areas evaluated:
Ordering and pickup experience
Speed of service
Friendliness
Loyalty
Order accuracy
Food quality
Overall experience
Let’s get into the results.
Key findings
Firstly, before unraveling topics, here were some insights that emerged.
Efficient ordering flows mattered
The greatest impact on pickup satisfaction owed to frustrations with ordering flow. Main drivers included technical glitches and unclear pickup instructions.
Some orders were still coming late
One in five shops were not ready on time. Pickup satisfaction plummeted when that happened—from 97 to 76 percent.
Good service saved a clunky experience
Even in today’s digital arena, humans had a chance to right wrongs. When orders were late, but service was still classified as “friendly,” pickup satisfaction was 80 percent. Late orders with a “neutral/not friendly” service rating touted 61 percent satisfaction. On the topic of flow efficiency, one in five stores had some level of frustration. Seventy-eight (17 percent) were slow or reported a minor hitch; 16 (4 percent) were labeled as frustrating. That had the biggest impact on pickup satisfaction.
When ordering flow was deemed efficient, the order was ready on time in 87 percent of restaurants. When it had hitches, the number fell to 53 percent. Inefficient and the percentage slid to 38 percent.
Whenever flow was inefficient and the order was not ready within a promised time—a combination of negative triggers—pickup satisfaction cratered to 20 percent.
Moving on to issues with flow, ordering process frustrations leveled the largest overall impact on pickup satisfaction. Out of the 14 comments left by shoppers who were frustrated, six mentioned app and technical glitches (like apps crashing, failure to submit orders, duplicated orders after error messages, or lack of estimated pickup times).
Another six noted pickup logistics and delays. A friction point was the handoff—pickup areas that were unused or ignored by staff, or orders that were not ready at the promised time.
Five mentioned missing items and accuracy. Four tacked on staff service and attitude.
When there were technical glitches, 74 percent of stores were viewed as inefficient or slow versus 16 percent when there weren’t any. And when pickup instructions were unclear, 43 percent were seen as inefficient or slow compared to 18 percent.
A straightforward way to put this is, restaurants suffer when there are compounded effects of friction. When ordering flow was efficient, speed of order was as expected or quicker in 94 percent of stores. Add in hitches, though, and it plunged to half.
When flow was frustrating and inefficient, 69 percent of restaurants were labeled as slower than expected. Pickup satisfaction was just 18 percent.
So, fixing operational friction is a multiplicative measure. It will improve speed perception and overall satisfaction alongside allowing for more orders.
Going deeper into time and expectations on arrival, as noted, one in five shops did not have orders ready when shoppers arrived. When there were technical issues, 34 percent of orders were late versus 20 percent when things ran smoothly. Shops were more frequently late for in-store pickup (24 percent) than drive-thru (10 percent).
The average time spent in store for orders ready on time was 2 minutes and 51 seconds. When the order was late, it leapt to 7 minutes and 10 seconds. For drive-thru, the numbers were 4 minutes and 39 seconds and 7 minutes flat, respectively.
One point to note: there were eight comments complaining about food preparation not starting until the customer arrived or clicked “I’m here.”
Customer service still matters in order-ahead. For late orders, one in three had a neutral/not friendly service rating. With on-time orders, it happened in 16 percent of locations.
These issues often centered on showing up, waiting, and never being acknowledged by an employee.
Again, friendly service can mitigate late orders (pickup satisfaction coming in at 80 percent when that was the case). Satisfaction dipped to 61 percent in the absence of it.
Apologizing for being late, managers stepping in, and other acknowledgements of an issue went a long way in keeping the interaction positive despite delays.
And how do you define “friendliness?” Eye contact and pleasant demeanor had the largest impact on perception. Service was rated as friendly 59 percentage points more frequently when the employee made eye contact. That happened 54 percentage points more often when an employee carried a pleasant demeanor.
Additionally, smiling increased the service score by 49 points. Saying thank you lifted it 30 percent.
When employees did none of the above, pickup satisfaction fell 35 percent.
Mystery shoppers also investigated what having a dedicated lane for pickup at the drive-thru changed. Thirty-three percent of visited Chick-fil-A restaurants and 8 percent of Dunkin’ stores had the separate option. The Chick-fil-A stores with a dedicated lane proved 49 seconds faster than when the extra lane wasn’t set aside (5 minutes and 23 seconds compared to 6 minutes and 12 seconds).
Meanwhile, Dunkin’ restaurants with a dedicated lane got a bit slower, by 16 seconds, at 4 minutes and 7 seconds versus 3 minutes and 51 seconds.
Regarding Chick-fil-A, pickup satisfaction with dedicated lanes was higher, reaching 100 percent (up from 97 percent). Service improved, too, with every shop deemed friendly (91 percent in non-dedicated lane locations).
Results and analysis
The data broke apart into five sections—app ordering experience and usability; pickup interaction and logistics; speed of service; accuracy and quality, and friendliness, personalization, and satisfaction.
With the first topic, high-level results showed apps, by and large, were performing reliably, with 92 percent of users reporting a glitch-free ordering experience, a 2 percent improvement year-over-year. Additionally, the barrier to entry was low for loyalty program sign-up through the app, with 95 percent of new users saying the process to onboard was easy.
Apps appear to successfully replicate in-store order modification capabilities. Ninety-five percent of users said nothing blocked them from doing so. The few issues reported were due to missing special instruction boxes rather than technical failures.
The user interface is also, mostly, bridging the gap between the digital order and physical location. Ninety percent of customers said they were provided with clear instructions on how and where to pick up meals. Still, there’s room to improve.
The frequency of upsells in this order-ahead study was 71 percent. That represented an improvement over legacy benchmarks. The drive-thru study was 58 percent and on-premises 60 percent, reinforcing, Intouch Insight explained, how mobile apps are more consistent at executing the “ask” than human staff. Similar results were reported from the voice-AI ordering segment of 2025’s Drive-Thru Study (also 71 percent).
In sum, technology continues to serve as a revenue generational lever.
For pickup interaction and logistics as a measure, mobile orders had a designed pickup area or lane 65 percent of the time. Results varied significantly across the study. One brand was 100 percent while others were as low as 8 percent.
Interactions with an employee during the pickup process were widely very common (86 percent of mystery shoppers saw this). The interaction rate was high across all brands, ranging from 74 to 98 percent.
An improvement area emerged with order confirmation at pickup. Employees confirmed the order before finalizing the transaction only 66 percent of the time. Rates scaled from a high of 79 percent to a low of 55 percent.
And despite the promotion of advanced features such as “ready on arrival” or “mobile-thru lanes,” adoption of “arrival technology” to identify customers when they show up remains low in drive-thru and in-store pickup methods. There’s a “digital check-in” gap.
Progressing to speed of service, Intouch Insight evaluated the duration of the pickup experience. For orders being picked up in the drive-thru, the time started when the mystery shopper entered the lane. For in-store pickup, it was upon store entry.
The average time for the 2026 study was 4 minutes and 53 seconds—faster than the 5 minute and 35 second average from the Drive-Thru Study (so, order-ahead pickup is, relatively, a quicker experience). Leveraging mobile ordering to remove the ordering portion of the experience, the study showed, can enable brands to increase throughput, especially during peak periods.
Picking up orders inside restaurants also showed quick results, with an average experience time of 3 minutes and 53 seconds.
The majority of shoppers were satisfied with the speed of their order. Eighty-four percent stated it was either quicker than expected or arrived exactly as expected.
While the perception of speed results varied by location and brand, expectation levels ranged from as high (faster than expected) as 66 percent claiming their order was “quicker than expected” at one brand to 38 percent noting it was “slower than expected” at another.
Accuracy and quality was a strong area, as you’d expect for order-ahead that turns input into a digital process. Mobile orders were filled correctly 92 percent of the time—a sizable gap above the Drive-Thru Study (87 percent).
A solid portion of mystery shoppers said the appearance and taste of their food exceeded their expectations. Very few across the study reported their meal looked or tasted stale.
Maintaining the expected food temperature was also a strength for mobile ordering. Three brands hit perfect scores in this year’s study.
On the final measure, most mystery shoppers described the ordering process as perfectly smooth and efficient. While many brands maintained high efficiency ratings, a large performance gap existed between the top-performing leaders and those at the bottom.
Although basic greetings were common, more advanced personalization (loyalty member recognition, for instance) remained low industry wide.
There was a measurable drop in the frequency of parting remarks, year-over-year. Some chains still excelled, but the larger industry seems to be focusing less on the final customer interaction.
And mobile ordering, sentiment wise, continues to be highly regarded. A large majority of shoppers reported they were likely to recommend the service to others. Overall satisfaction with the pickup experience was notably high across drive-thru and in-store methods.
In this story
This story was originally published by Danny Klein in QSR Magazine on May 15, 2026. Burnaze summarizes and links to the original reporting.
Read the full story at QSR MagazineLiked this? Get the week's franchise news, explained
- Sunday 8 AM ET weekly + a monthly deep dive
- Sections picked for the industries you follow
- Every claim linked to its source. Free.